Singapore’s Fiscal Policy
Singapore’s fiscal policies have helped to steward the country’s progress over the years. They aim to create the conditions for macroeconomic stability, support economic growth, and promote social equity. We achieve this by maintaining a balanced budget, investing for the future, and ensuring a fair and progressive fiscal system.
Our fiscal policies are designed to support the following key objectives:
What do we spend on?
Public spending is focused on public goods and infrastructure that enable our people and businesses to thrive and grow. We invest heavily in skills, education and infrastructure to develop our people and lay the foundations for long-term economic growth. We also commit a steady amount of spending on security and defence to safeguard our way of life.As our society matures and ages, an increasing proportion of public spending has been channelled towards social spending. Over the last decade, we have almost doubled our social spending from $20 billion in Financial Year (FY) 2010, to $37 billion in FY2019. Today, social spending makes up the largest part of annual government expenditure. A large part of the increase has gone towards improving the quality, accessibility and affordability of healthcare, for which spending has tripled over the last decade.
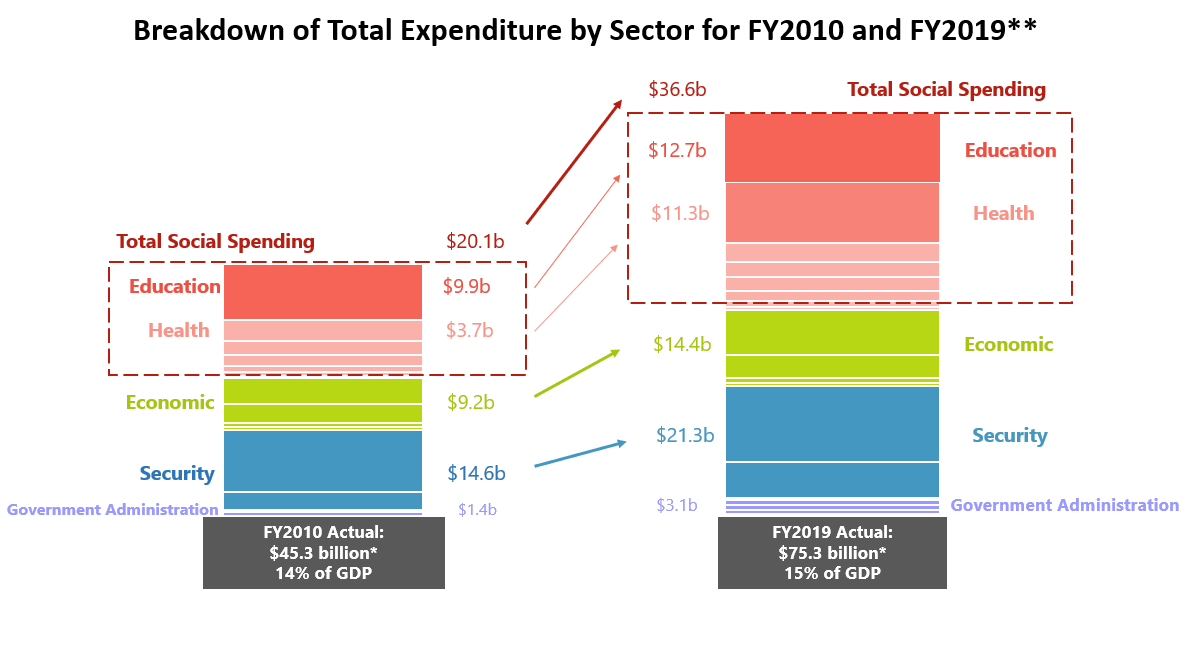
* Refers only to Ministries Expenditure, Excluding Special Transfers and Top-ups to Endowment/ Trust Funds
** There were 5 sectoral categories under Ministries Expenditure previously – 1) Social, 2) Infrastructure, 3) Economic, 4) Security and 5) Government Administration. Infrastructure is now subsumed under both Social and Economic expenditure to ensure consistency with the Analysis of Revenue and Expenditure document, which breakdowns Ministries Expenditure in 4 categories as shown above.
Planning for the long-term
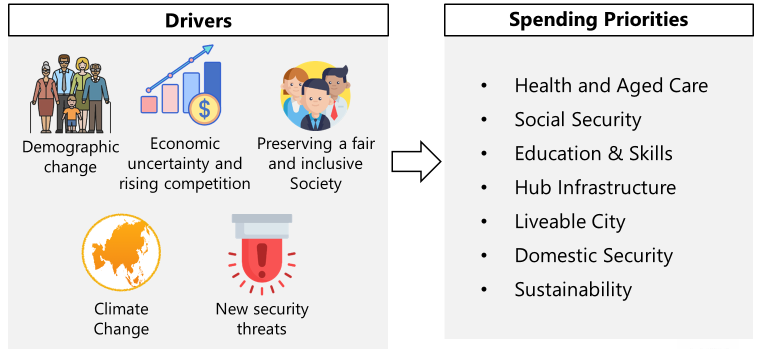
Fiscal policy in Singapore is characterised by a strong long-term orientation. We plan far ahead to prepare for longer-term challenges such as ageing and climate change. Doing so enables us to intervene effectively upstream, to avoid more costly interventions downstream. It also enables us to help our society and economy adjust to the challenges.
We are planning ahead to cater for several new spending priorities going forward, including health and aged care, pre-school education and SkillsFuture, strengthening our social security systems, renewing our city infrastructure, and protecting ourselves against new security threats.
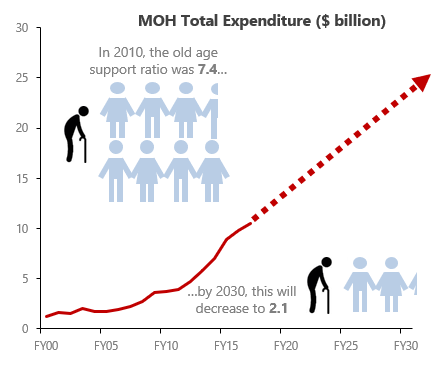
In particular, government spending on healthcare will continue to rise to meet the needs of our ageing population. This will go towards giving our seniors greater assurance over healthcare, and a better quality of life.
Spending for outcomes
Even as we ensure sufficient public spending to meet our economy’s and society’s changing demands, we seek to maintain a light fiscal burden on taxpayers. We seek to achieve strong outcomes while delivering value for money for taxpayers. Today, government expenditure as a share of GDP is among the lowest across advanced economies.
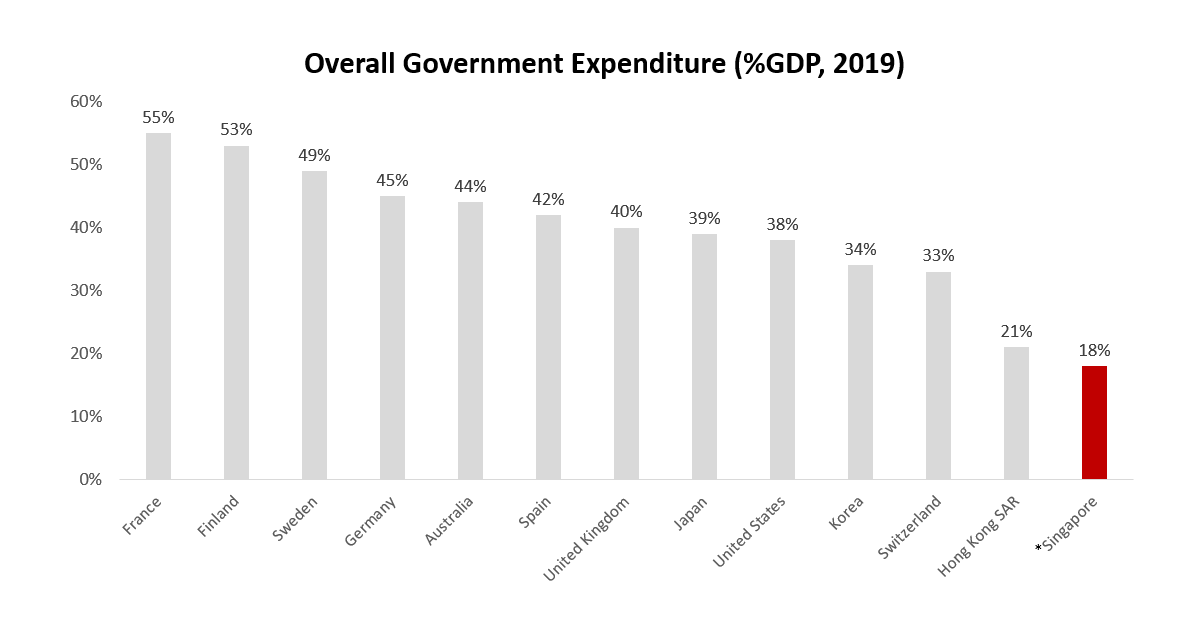
Source: OECD database (https://data.oecd.org) and Hong Kong Census and Statistics Department (https://www.censtatd.gov.hk)
* This includes Special Transfers and Top-ups to Endowment and Trust Funds
While we spend relatively less of our GDP as a Government, we focus on the quality rather than the volume of spending. In areas such as education, health, policing, we have consistently achieved outcomes near the top internationally (e.g. PISA, healthy life expectancy, Gallup law and order index) despite low levels of spending as a percentage of GDP.
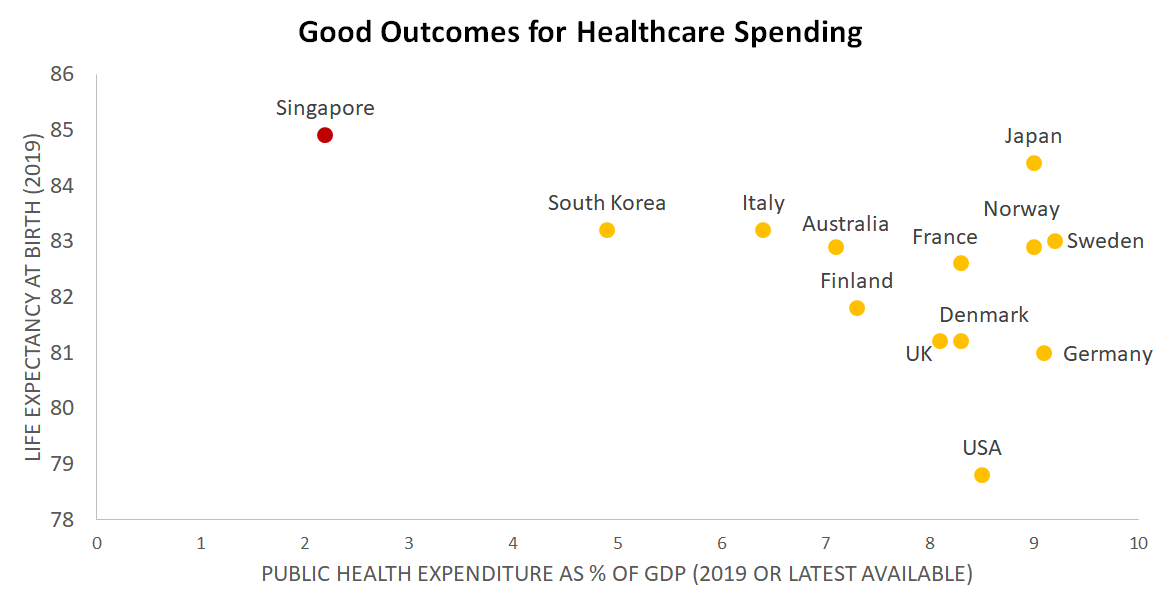
Sources: WHO (Global Health Expenditure Database) and World Bank Data. MOF data is proxied using MOH total expenditure
Note:
Expenditure data as of 2019 - For Singapore we used 2019 for GDP, FY2019 for healthcare spending. For other countries, healthcare spending is as % of GDP is 2019 or latest avail year.
Life expectancy as of 2019 - latest available is 2019
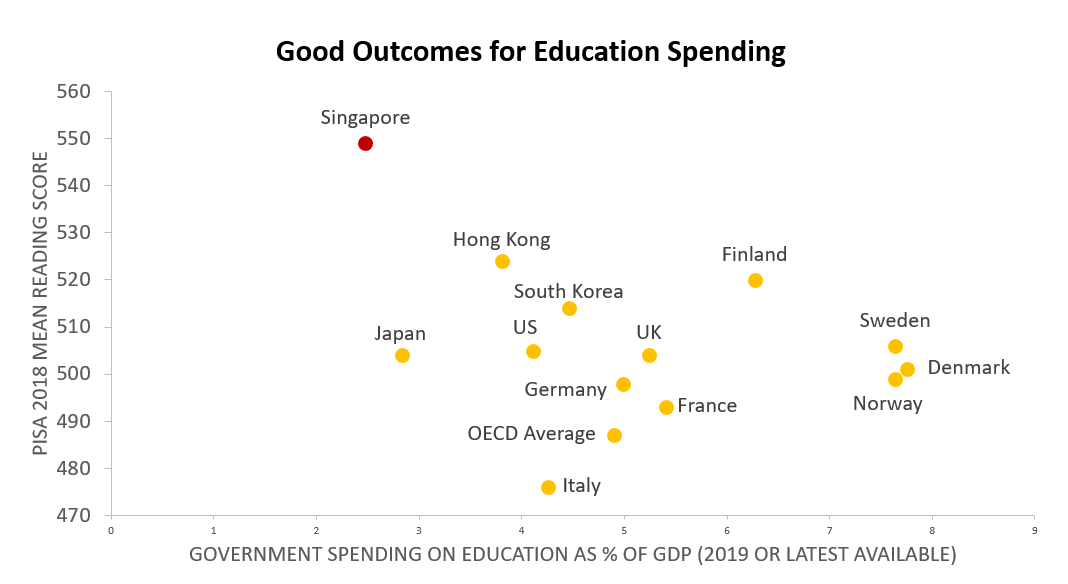
Sources: UNESCO Institute for Statistics, OECD, MOF. Data for Singapore is proxied using MOE total expenditure.
Note:
Expenditure - For Singapore we used 2019 for GDP, FY2019 for education spending. For other countries, education spending as % of GDP is 2019 or latest avail year.
PISA scores - latest available is 2018
Stewarding our resources for the future
Financial strength helps a small country with no natural resources like Singapore to respond effectively to crises. Over the years, we have been prudent and disciplined in building up our reserves. Our reserves have allowed us to deal with unexpected shocks such as the COVID-19 outbreak and be able to respond decisively by supporting Singaporeans and our workers amidst the pandemic. Unlike many other countries, our reserves have allowed us to do so without borrowing heavily and passing on the financial burden to future generations.
The total draw on reserves is up to $42.9 billion from FY2020 to FY2022, less than the initial sum of $52.0 billion announced at the Fortitude Budget in FY2020. This is in part because of our swift and decisive response to the pandemic, which enabled us to avert worse public health outcomes. It reflects our prudence in the use of reserves.
Our reserves also contribute significantly to our current revenues. We have invested our reserves for the long-term, and the returns generated from investing our reserves are shared between present and future generations. Part of the investment returns generated supplement our annual budget through the Net Investment Returns Contribution (NIRC). Today, the NIRC forms the largest, single component of Government revenues. We have to plan our revenues prudently, to ensure that each generation contributes and benefits fairly from the Budget.
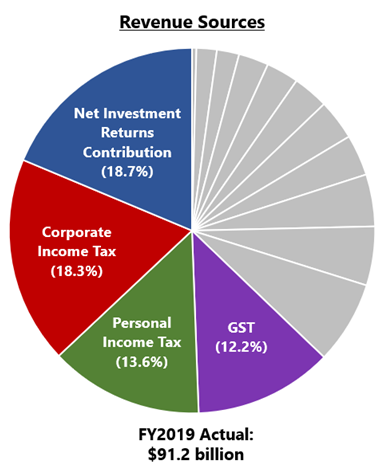
This is unlike the situation in many other advanced economies today. Most advanced countries pay about 2% of their GDP in debt servicing of accumulated debt (as shown at the lower half of the chart below). They collect taxes to pay off these debts. In Singapore, it is the opposite – we have grown a steady stream of returns from investments of our reserves for current spending (as shown in the top half of the chart below), which helps to keep our taxes low. This in turn helps to support many important areas of expenditure that are important to Singapore’s development and future growth. For example, the annual amount from NIRC is larger than our annual spending on education.
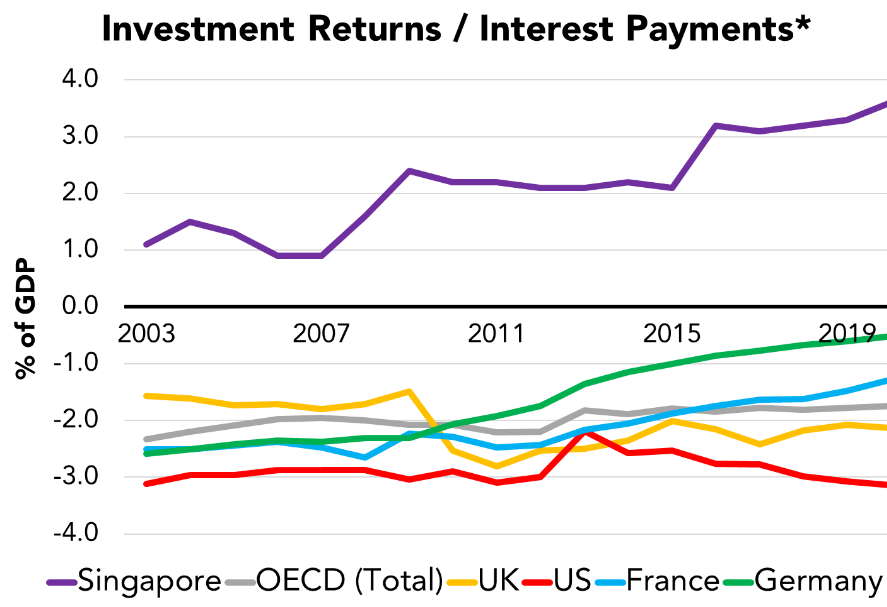
*Investment returns refers to Net Investment Returns Contribution. Interest payments refer to net general government interest payments, retrieved from OECD Economic Outlook No. 106 (Nov 2019)
Building capabilities and delivering inclusive growth
While the share of public spending on development expenditure has declined in many advanced economies, Singapore continues to devote a large part of our budget to development and investment. About 25% of our budget is devoted to development expenditure. This has allowed us to build up the capabilities to secure Singapore’s future growth, and enable our people and firms to grow and compete in a global arena.The Government is investing strongly to accelerate our innovation and digitalisation push, grow our base of innovative enterprises, and pursue new frontiers of growth. We are investing in research in areas like health and biomedical sciences, climate change and artificial intelligence. We are forging stronger connections to major innovation nodes and key demand markets, through trade facilitation and digital economy agreements, platforms like the Networked Trade Platform and Global Innovation Alliance, and by pressing on with major investments in our port and airport.
We also invest strongly in our people throughout life, starting from the early years. This enables our people to take on the new opportunities created and raise our standard of living.
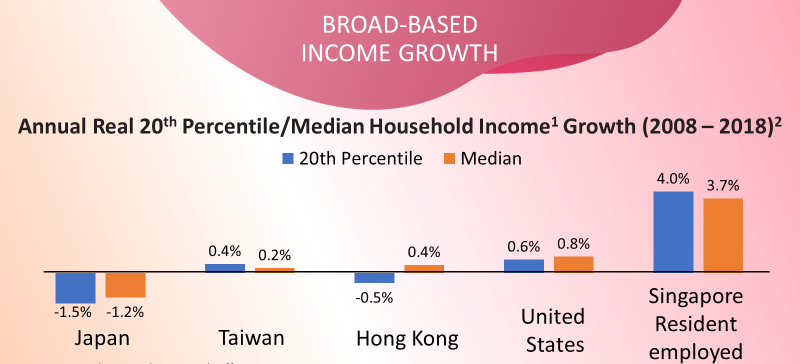
Through our strategies, all Singaporeans have been able to enjoy the fruits of progress. As can be seen in the chart below, the growth that we have experienced is higher than that of many other advanced economies, and is also more broad-based.
Source: DOS and National Statistical Offices
1Income figures for Japan, Taiwan, Hong Kong, and US are based on income from all sources among all households.
Income figures for Singapore are based on Income from work among resident employed households.
Income growth figures have been adjusted for household size where possible (except Hong Kong and Taiwan).
2Figures for Hong Kong are from 2016. Figures for Singapore are from 2009 to 2019.
Working in partnership
Singapore’s fiscal policy seeks to encourage collective responsibility at all levels of society. It aims to support, enable, and amplify the efforts, ideas and initiatives of the business and people sectors, to build a better Singapore together.Our success in building a vibrant economy, inclusive society and a better home will increasingly hinge on strong partnerships between Government, businesses and community. We can achieve this through the Singapore Together movement, to collectively harness the best of our people and ideas.
Fair system of taxes and transfers
We are committed to ensure that our overall system of taxes and transfers is progressive – with the better-off contributing more, and lower- and middle-income households receiving more in benefits than the taxes they pay. Today, when you look at the overall balance of taxes and transfers, lower- and middle- income households receive proportionately more benefits from transfers than what they pay in taxes.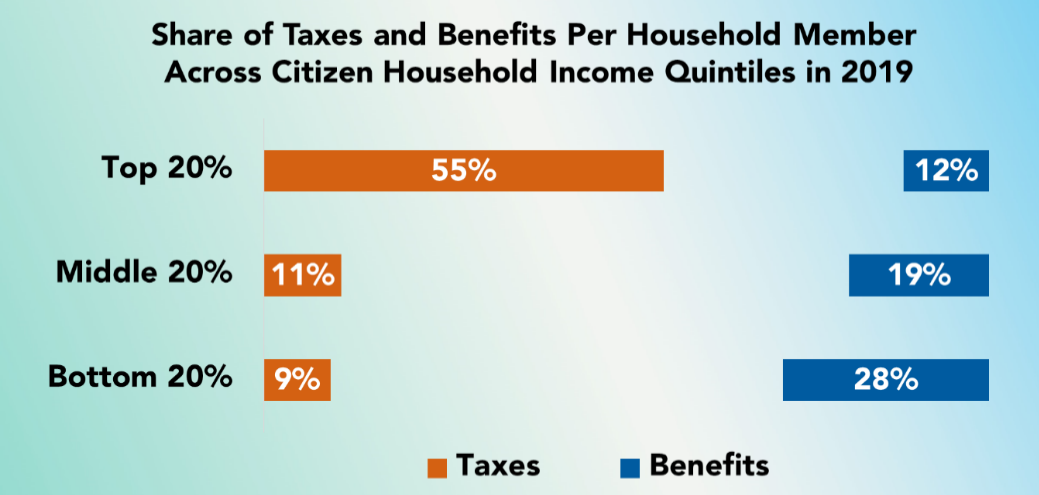
Source: MOF Estimates
Note: Benefits include all government transfers, subsidies and rebates. Taxes include direct and indirect taxes.
Over the years, we have also strengthened support for low-wage workers, vulnerable seniors, and households with greater caregiving burdens, through programmes like Workfare and Silver Support.
Fostering social mobility
Our fiscal policy aims to provide a foundation of broad-based opportunities that enables everyone to earn their own success. We redistribute resources in a way that enhances the capability of our people, through investments in areas like education and housing. In these areas, we provide more support for lower- and middle-income groups.In education, we have invested significantly in pre-school and in a high-quality public school system that is accessible to all, so as to equalise opportunities when children are young. Within the next few years, we will double our annual spending on affordable, quality pre-school education from 2018 levels. We have also been allocating extra resources to students from disadvantaged backgrounds and will continue to do so. This includes expanding KidStart, to help lower-income families and their children in the earliest years, which are critical to their development. We will also strengthen UPLIFT efforts to help those at risk. Our heavy investment in education also extends into strong tertiary pathways through ITE, polytechnic, universities, and increasingly to lifelong learning.
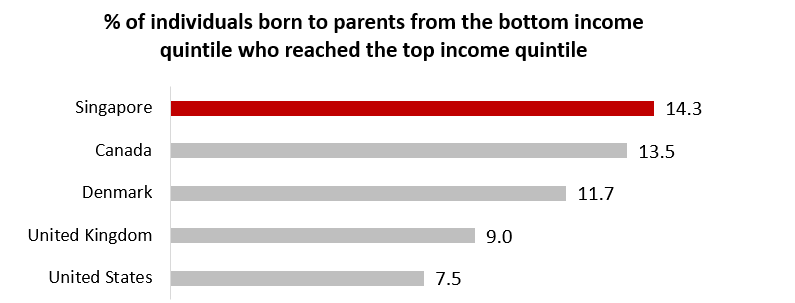
Today, Singaporeans who grow up in lower income families have a better chance of moving up the income ladder than those in most other advanced countries. Based on the 1978-1982 birth cohorts, 14.3% of those born to families from the lowest 20% in household income made it to the highest 20% by income.
Source: MOF Occasional Paper (2015), Chetty et al. (2014) - US, Connolly et al. (2019) - Canada
Analysis of Revenue and Expenditure ( 793 KB, 45 KB)
Revenue and Expenditure Estimates ( 7,195 KB)
View and download individual Revenue and Expenditure Estimates or complete set in here (24,586 KB).
OVERALL FISCAL POSITION IN FY2022
Swipe to view more
| Revised FY2021 | Estimated FY2022 | Change Over Revised FY2021 | ||
| $billion | $billion | $billion | % change | |
| OPERATING REVENUE | 80.37 | 81.75 | 1.39 | 1.7 |
| Corporate Income Tax | 17.51 | 18.19 | 0.68 | 3.9 |
| Personal Income Tax | 13.83 | 13.98 | 0.16 | 1.1 |
| Withholding Tax | 1.73 | 1.83 | 0.10 | 6.0 |
| Statutory Boards' Contributions1 | 2.86 | 2.03 | (0.83) | (28.9) |
| Assets Taxes | 4.60 | 4.61 | 0.01 | 0.3 |
| Customs, Excise and Carbon Taxes | 3.63 | 3.71 | 0.07 | 2.0 |
| Goods and Services Tax | 12.01 | 12.80 | 0.79 | 6.6 |
| Motor Vehicle Taxes | 2.39 | 2.53 | 0.13 | 5.5 |
| Vehicle Quota Premiums | 3.22 | 3.93 | 0.71 | 22.1 |
| Betting Taxes | 2.32 | 2.74 | 0.42 | 18.0 |
| Stamp Duty | 6.45 | 5.24 | (1.21) | (18.8) |
| Other Taxes2 | 5.46 | 6.05 | 0.58 | 10.7 |
| Fees and Charges (Excluding Vehicle Quota Premiums) | 3.44 | 3.55 | 0.10 | 3.0 |
| Others | 0.90 | 0.57 | (0.34) | (37.4) |
| Less: | ||||
| TOTAL EXPENDITURE | 98.41 | 102.41 | 4.00 | 4.1 |
| Operating Expenditure | 81.54 | 85.06 | 3.52 | 4.3 |
| Development Expenditure | 16.87 | 17.35 | 0.48 | 2.8 |
| PRIMARY SURPLUS / DEFICIT1 | (18.04) | (20.65) | ||
| Less: | ||||
| SPECIAL TRANSFERS4 | 7.90 | 6.24 | (1.66) | (21.0) |
| Special Transfers Excluding Top-ups to Endowment and Trust Funds | 7.90 | 2.19 | ||
| Jobs Support Scheme | 4.66 | 1.60 | ||
| Other Transfers5 | 3.23 | 0.59 | ||
| BASIC SURPLUS / DEFICIT6 | (25.94) | (22.84) | ||
| Top-ups to Endowment and Trust Funds | - | 4.05 | ||
| Progressive Wage Credit Scheme Fund7 | - | 2.00 | ||
| GST Voucher Fund | - | 1.00 | ||
| National Research Fund | - | 0.90 | ||
| Cultural Matching Fund | - | 0.15 | ||
| Add: | ||||
| NET INVESTMENT RETURNS CONTRIBUTION | 20.33 | 21.56 | 1.23 | 6.0 |
| Less: | ||||
| INTEREST COSTS AND LOAN EXPENSES8 | 0.009 | 0.10 | 0.10 | n.a. |
| OVERALL BUDGET SURPLUS / DEFICIT | (5.61) | (5.43) | ||
| Add: | ||||
| CAPITALISATION OF NATIONALLY SIGNIFICANT INFRASTRUCTURE | 0.66 | 2.40 | 1.74 | 265.4 |
| Less: | ||||
| DEPRECIATION OF NATIONALLY SIGNIFICANT INFRASTRUCTURE | - | - | - | - |
| OVERALL FISCAL POSITION | (4.95) | (3.04) | ||
Footnotes:
Note: Due to rounding, figures may not add up. Negative figures are shown in parentheses.
- To reduce annual volatility, Statutory Boards’ Contributions (SBC) from MAS in a given financial year are calculated as the average of “Contribution to Consolidated Fund” reported in MAS’ financial statements for the preceding three years.
- Prior to FY2022, Other Taxes include the Foreign Worker Levy, Water Conservation Tax, Development Charge, and Annual Tonnage Tax. From FY2022 onwards, Other Taxes include the Foreign Worker Levy, Water Conservation Tax, Land Betterment Charge, and Annual Tonnage Tax.
- Surplus / Deficit before Special Transfers (including Top-ups to Endowment and Trust Funds), Net Investment Returns Contribution, Interest Costs and Loan Expenses, and Capitalisation and Depreciation of Nationally Significant Infrastructure.
- Special Transfers including Top-ups to Endowment and Trust Funds.
- Includes Wage Credit Scheme, Workfare Special Bonus, Productivity and Innovation Credit, Service and Conservancy Charges Rebates, Top-ups to Child Development Accounts, Top-up to self-help groups, CPF MediSave Top-up scheme, Top-ups to Edusave Accounts and Post-Secondary Education Accounts, SME Cash Grant, Productivity and Innovation Credit Bonus, Rebate for School Buses, Merdeka Generation Package, Care and Support Package - Cash Payout, PAssion Card Top-up, Grocery Vouchers, GST Voucher Special Payment, CPF Transition Offset, Self-Employed Person Income Relief Scheme, Cash Grant to Mitigate Rental Costs, Rental Support Scheme, and Solidarity Utilities Credit.
- Surplus / Deficit before Top-ups to Endowment and Trust Funds, Net Investment Returns Contribution, Interest Costs and Loan Expenses, and Capitalisation and Depreciation of Nationally Significant Infrastructure.
- The Progressive Wage Credit Scheme Fund will be set up in FY2022. The Progressive Wage Credit Scheme will co-fund wage increases of lower-wage workers to provide transitional support for employers for the Progressive Wage moves.
- Interest Costs and Loan Expenses include the annual effective interest cost (which is computed based on the yield to maturity multiplied by the face value of the bond) and other ancillary loan expenses incurred in connection with the SINGA. It excludes principal repayment and transfer of loan discount to Development Fund. It is different from the Debt Servicing and Related Costs presented in the Expenditure Estimates and Annex to Expenditure Estimates for Head Y.
- Interest Costs and Loan Expenses for Revised FY2021 is estimated to be $0.11 million.
